
How Much Muscle Do You Need to Live Longer and Stay Cognitively Sharp?

I started personal strength training coaching recently with Ian White, an angel investor in NeuroAge and longevity coach. He offers strength coaching as a perk to the CEOs he invests in as he has the thesis that fit CEOs are better performers overall. I agree and am tickled that this is part of my life.
As I was leg pressing with Ian the other week, I started thinking about what my strength goals should be. What is an optimal amount of weight to be able to lift for a woman my age who wants to optimize healthspan and brain health in particular? Despite being a former college athlete who used to lift regularly, I had no idea.
It turns out that the amount of muscle you carry, how strong it is, and how fast you can use it are among the most powerful predictors of whether you will live independently at 90 or need assistance at 70. In this article walk through what the longevity research says about muscle mass, strength, and power, with specific targets by sex and age range, the types of strength exercises that matter most for longevity and the surprisingly strong evidence that resistance training is amongst the best exercise types for protecting the aging brain.
I covered the full exercise picture in my earlier article on exercise for cognitive sharpness and dementia prevention.
Greater muscle predicts 20% lower mortality
A landmark NHANES III study led by Dr. Preethi Srikanthan and Dr. Arun Karlamangla at UCLA followed 3,659 older adults over 10 to 16 years, measuring skeletal muscle mass using a technique called bioelectrical impedance (a painless test that sends a small electrical signal through the body to estimate how much muscle versus fat a person carries).
A more precise option available today is a DEXA scan (dual-energy X-ray absorptiometry), which uses low-dose X-rays to separately measure bone, fat, and lean tissue in each region of the body. If you want to know where you stand on muscle mass, a DEXA scan is the gold standard that most longevity clinics and many imaging centers now offer.
The researchers created a muscle mass index (muscle mass divided by height squared, similar to BMI but measuring muscle instead of total body mass) and found that people in the top quarter of muscle mass had roughly 19-20% lower mortality rates from all causes compared to those in the bottom quarter.
The sex-specific cutpoints for these quarters were 6.2, 6.9, and 7.6 kg/m² for women, and 9.2, 10.0, and 10.8 kg/m² for men. Being above the 50th percentile was where the survival benefit became statistically meaningful, and the benefit largely leveled off above the 75th percentile. You do not need to be a bodybuilder, but you do need to be solidly above average to have a lifespan benefit.
This relationship held even after accounting for heart disease risk factors, inflammation, insulin resistance, and blood sugar processing, suggesting that muscle mass is an independent marker for survival.
Strength matters more than mass for predicting lifespan
Having muscle is good, but being able to use it matters more. A study using NHANES data by Dr. Ran Li and colleagues examined the individual and combined contributions of low muscle mass and low muscle strength to death from all causes in adults over 50. Low muscle strength (defined by how much force a person could generate extending their knee, measured in the weakest 25% of the study population) was strongly associated with dying during the follow-up period. Low muscle mass alone was not significantly associated with mortality risk unless it was adjusted for body weight.
What about when the researchers combined the two measures? People with low strength but adequate mass still had elevated mortality risk. People with low mass but adequate strength did not. Strength, not size, was the independent driver of survival.
This makes sense once you understand what happens inside aging muscle. As people get older, fat infiltrates the muscle tissue itself, so on a scan or measurement the muscle still looks big, but a meaningful portion of what used to produce force is now inert tissue. At the same time, the nervous system loses its ability to recruit motor units (the nerve-muscle connections that activate fibers) quickly and simultaneously. And the type II (fast-twitch) fibers that produce the most force are preferentially lost with aging, replaced by slower, weaker fibers or by connective tissue. The result is that two people with identical muscle measurements can have very different functional capacity. Size alone cannot capture these changes, which is why strength and power are the better predictors.
A meta-analysis (a study that pools results from many individual studies to find patterns) encompassing 38 studies and approximately 2 million participants confirmed this at scale. Higher grip strength was associated with a 31% lower risk of dying from any cause. The protective effect was actually stronger in women (a 40% risk reduction) than in men (31%).
Power predicts mortality better than strength alone
Strength is how much force you can produce. Power is how much force you can produce quickly. Think of the difference between slowly pushing yourself out of a chair versus springing up from a chair. Both require strength, but the second one requires power. The distinction becomes critical with aging because the speed component deteriorates faster than the force component.
A 2025 study published in Mayo Clinic Proceedings from the CLINIMEX cohort in Brazil examined nearly 3,900 adults aged 46 to 75 over about 11 years of follow-up. Participants were categorized by both their relative muscle power and relative muscle strength (both adjusted for body weight). Those in the lowest category of relative muscle power had a nearly 6-fold higher mortality risk among men and a nearly 7-fold higher risk among women compared to those in the highest category. The corresponding numbers for relative strength were far smaller and did not reach statistical significance.
A large European study of nearly 10,000 adults confirmed that relative muscle power declined steeply after age 50 in both women and men, and was more strongly associated with mobility limitations, cognitive decline, and mortality than either muscle mass or strength alone.
This has direct implications for how people should train. Lifting heavy and slow builds strength but does not fully train the speed component. Power requires intentional speed on the lifting phase of each repetition.
The functional strength tests that predict how long you will live
The longevity research does not typically measure bench press or bicep curl performance. Instead, it relies on a handful of practical tests that have been validated against mortality outcomes. Below I discuss these metrics and then translate them into targets for lifting at the gym in later sections.
Grip strength is the most studied single predictor
Grip strength is measured by squeezing a handheld device called a dynamometer as hard as possible. It turns out this single measurement is one of the strongest predictors of future health and longevity in all of exercise science.

Population-based data from the NIH Toolbox and 12 British cohort studies show that grip strength peaks in the late 20s to early 30s, holds roughly steady through the mid-40s, and then declines. According to German national data, peak average values are about 119 lbs for men and 76 lbs for women. By age 65-69, average grip has dropped to about 97 lbs for men and 62 lbs for women.
A Taiwanese population study estimated a loss of about 7.7 lbs of grip strength per decade after 65, with men losing faster than women (about 1.2 lbs per year versus 0.5 lbs per year).
The clinical cutoffs widely used for screening for sarcopenia (the medical term for age-related muscle loss that has become severe enough to affect daily function) are 57 lbs for men and 35 lbs for women. Falling below these numbers at any age is a significant warning sign for functional decline and mortality risk.
Grip strength targets by age in pounds
The following reference ranges are compiled from US, British, and German population data for dominant hand grip.
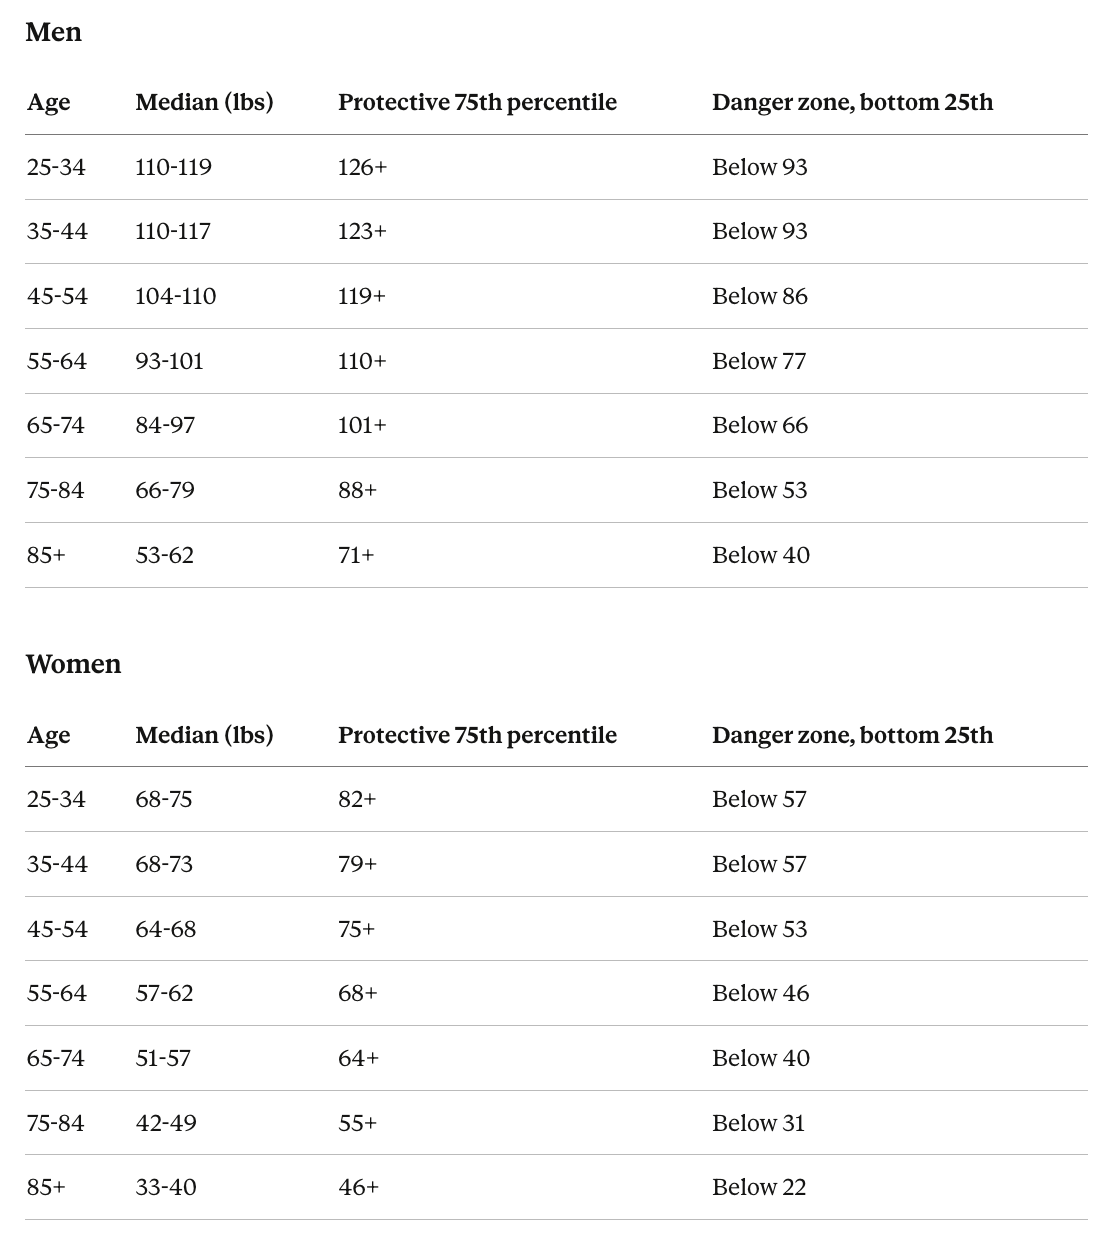
Among adults 90 and older across 28 European countries, those at the 90th percentile of grip strength (77 lbs for men, 51 lbs for women) had a 25% lower mortality risk compared to the median, while those at the 10th percentile (33 lbs for men, 22 lbs for women) had mortality risks 19-33% higher. The relationship was gradual and curved rather than based on a single cutoff, meaning every increment of grip strength matters.
The sit-to-stand test captures lower body power and predicts disability
The five-repetition sit-to-stand test asks someone to stand up from a standard chair and sit back down five times as quickly as possible.

Data across the age span show average completion times ranging from about 6 seconds in 20-29 year olds to 10.8 seconds in 80-85 year olds. The Longevity Check-Up 7+ project, which assessed muscle strength across ages in thousands of Italian community-dwellers, found that performance remains stable until around age 40-44 and declines after that, with people in their 70s experiencing roughly a 30% loss relative to peak values.
When this test is combined with body mass, height, and chair height to estimate actual power output (measured in watts, a unit of power), the results become even more predictive. A cross-sectional analysis found that sit-to-stand power decreases approximately 11-12% per decade in men and about 10% per decade in women after age 50, and that men begin their power decline earlier than women.
How to measure your muscle power at home
In a 2018 study, Dr. Julian Alcazar and colleagues validated a simple formula that lets anyone estimate their lower body muscle power using only a stopwatch, a chair, a scale, and their height. The formula works like this.
First, perform the five-repetition sit-to-stand test described above, timing yourself to the nearest second. Then calculate your power using your body weight in kilograms, your height in meters, the chair seat height in meters (a standard dining chair is about 0.43-0.46 meters or 17-18 inches), and your time to complete all five repetitions.
The simplified calculation is: Power (watts) = body weight (kg) x 9.8 x (half your height minus chair height) x 5, divided by your time in seconds. Then divide that number by your body weight to get your relative power in watts per kilogram (W/kg). The relative number is what matters for predicting health outcomes, because it tells you how much power you produce for every kilogram you need to move through space.
For example, a 170-lb (77 kg) man who is 5’10” (1.78 m) and completes five sit-to-stands in 10 seconds on a standard 18-inch (0.46 m) chair: Power = 77 x 9.8 x (0.89 - 0.46) x 5 / 10 = 162 watts. Relative power = 162 / 77 = 2.1 W/kg, which falls right at the threshold for concern described below.
What the power benchmarks mean
Dr. Alcazar’s 2021 study of over 9,300 European adults aged 60 to 103 established clear thresholds. Relative sit-to-stand power below 2.6 W/kg in men and below 2.1 W/kg in women was classified as low, and people below these cutoffs had dramatically higher rates of mobility limitations. Men with low power had 14 times the odds of mobility limitations compared to men with normal power, and women with low power had about 11 times the odds.
A separate analysis from the same research group found that the absolute minimum power needed just to stand up from a chair is about 1.0 to 1.1 W/kg. Every person below that threshold had mobility limitations, and more than half also had disability in daily activities like bathing and dressing.
Here is how to interpret your score. Above 3.5 W/kg for men or 2.8 W/kg for women places you well within the healthy range. Between 2.6 and 3.5 for men (or 2.1 and 2.8 for women) is adequate but leaves limited reserve. Below 2.6 W/kg for men or 2.1 W/kg for women means your power has crossed into the range associated with mobility problems, frailty, and increased mortality risk. Below 1.5 W/kg is approaching the threshold where basic tasks like getting out of a chair become difficult.
Because relative power factors in body weight, losing excess body fat improves your score even without gaining any muscle. This is one reason the research finds that combining resistance training with body composition management produces better functional outcomes than either alone.
Five-repetition sit-to-stand targets by age
Data from the NIH Toolbox and other population studies
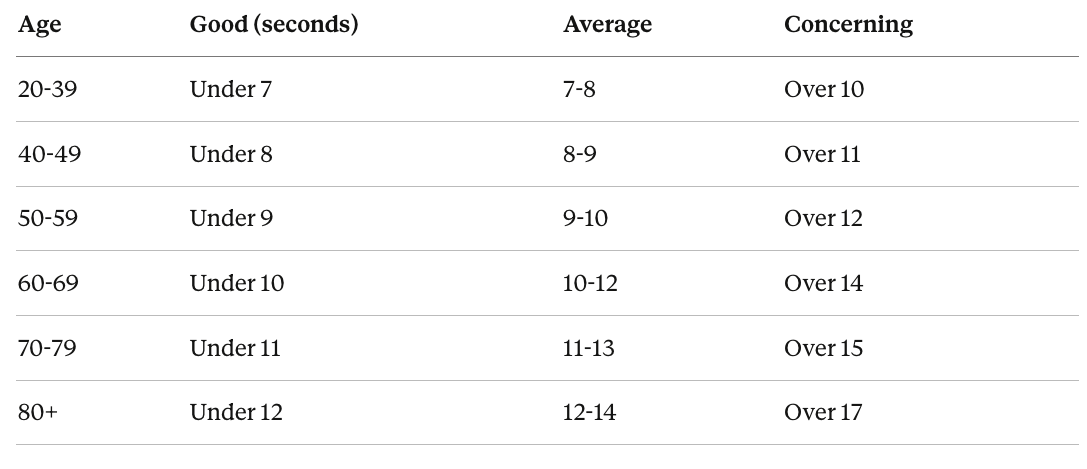
These values do not differ substantially by sex. A completion time above 15 seconds is used as a cutoff in many screening tools for age-related muscle wasting and signals a meaningful risk for falls, disability, and loss of independence.
Translating functional strength data into gym lift targets
The studies that link muscle strength to mortality use grip dynamometers, sit-to-stand tests, and knee extension force rather than free weights or gym machines. No published study has directly linked a bench press or leg press number to mortality risk. However, one large study of 7,627 adults from the Cooper Center Longitudinal Study did find that higher bench press strength was associated with reduced stroke risk during follow-up, with those in the highest strength category having a 19% lower risk compared to the lowest category after full adjustment.
The targets below are constructed by combining several data sources. For leg press and chest press in adults over 60, a 2021 study by Dr. Joseph Signorile and colleagues compiled maximal strength values from 445 independent-living older adults (ages 60-85) tested on pneumatic resistance machines. For younger age groups, the targets draw on ACSM and NSCA fitness testing guidelines, the 809,986-entry drug-tested powerlifting dataset adjusted downward for general population applicability, and the documented rate of age-related strength decline from the studies discussed above.
A note on how to read these numbers. The targets below are given as the weight you should be able to lift for a set of 8-10 repetitions with good form. This is roughly 75% of what you could lift for a single all-out effort. This format is more useful than a single-rep maximum because most people train in this range, and it is safer and more practical to test.
These numbers represent a “longevity-protective zone” rather than a precise clinical cutoff. The goal is to be solidly above the 50th percentile (the median) for your age and sex, because that is the range where the mortality studies consistently show benefit.
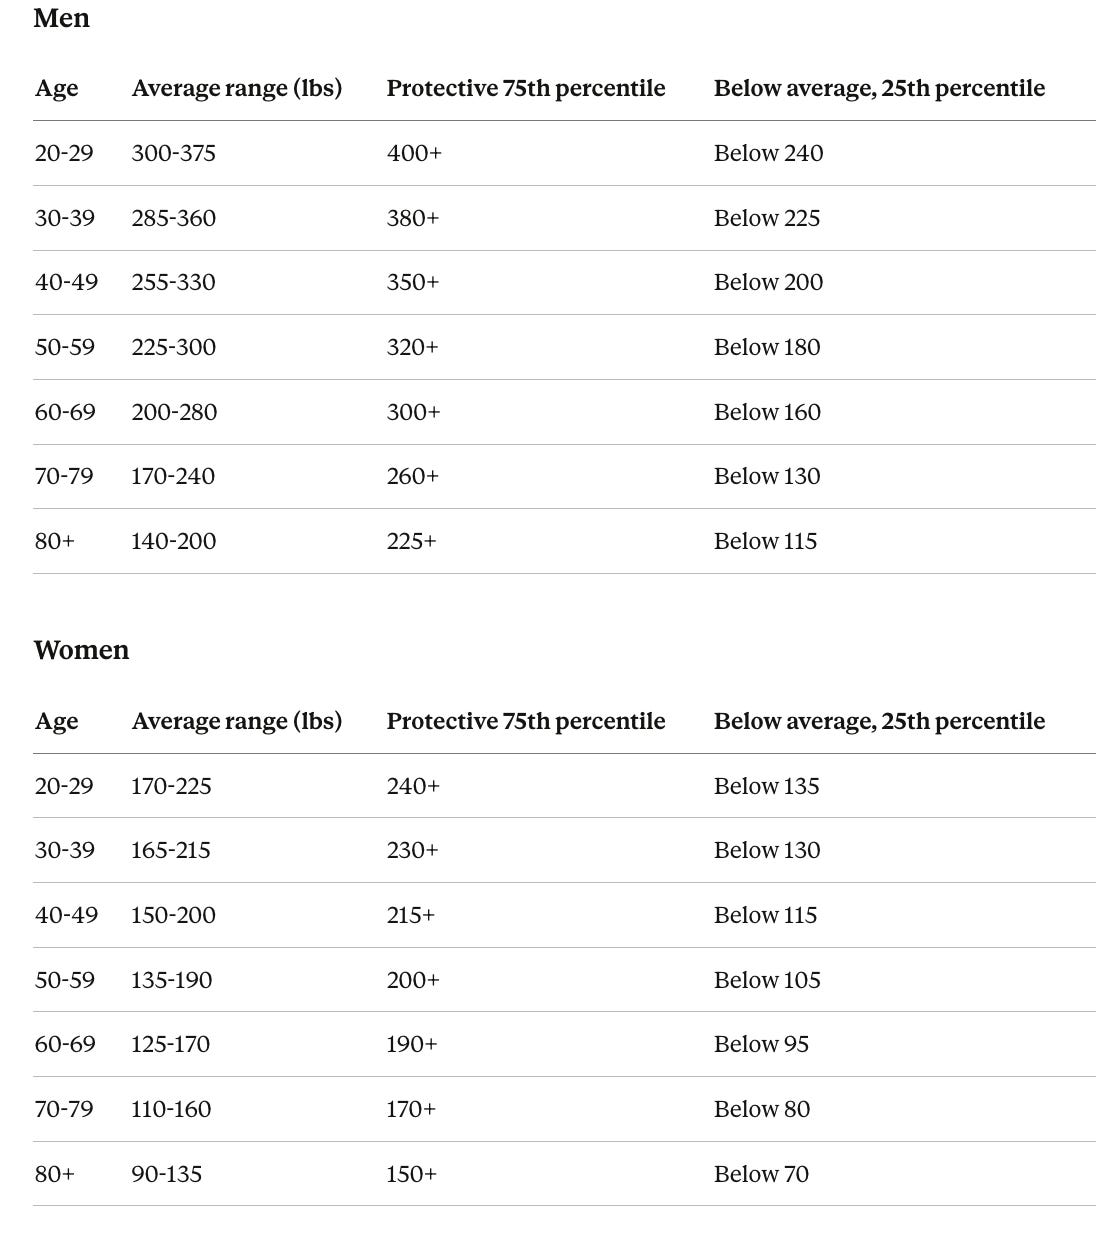
Leg press targets by age (weight for a set of 8-10 reps, in pounds)
The Signorile data for adults 60 and older showed average maximal leg press values of 522 lbs for men aged 60-64 (roughly 2.8 times bodyweight), declining to 379 lbs by ages 80-85. Women in the same study showed values ranging from approximately 275 to 220 lbs across the same age span. The values below represent approximately 75% of those maximums, which is the weight a person at that level of strength could handle for 8-10 controlled reps.
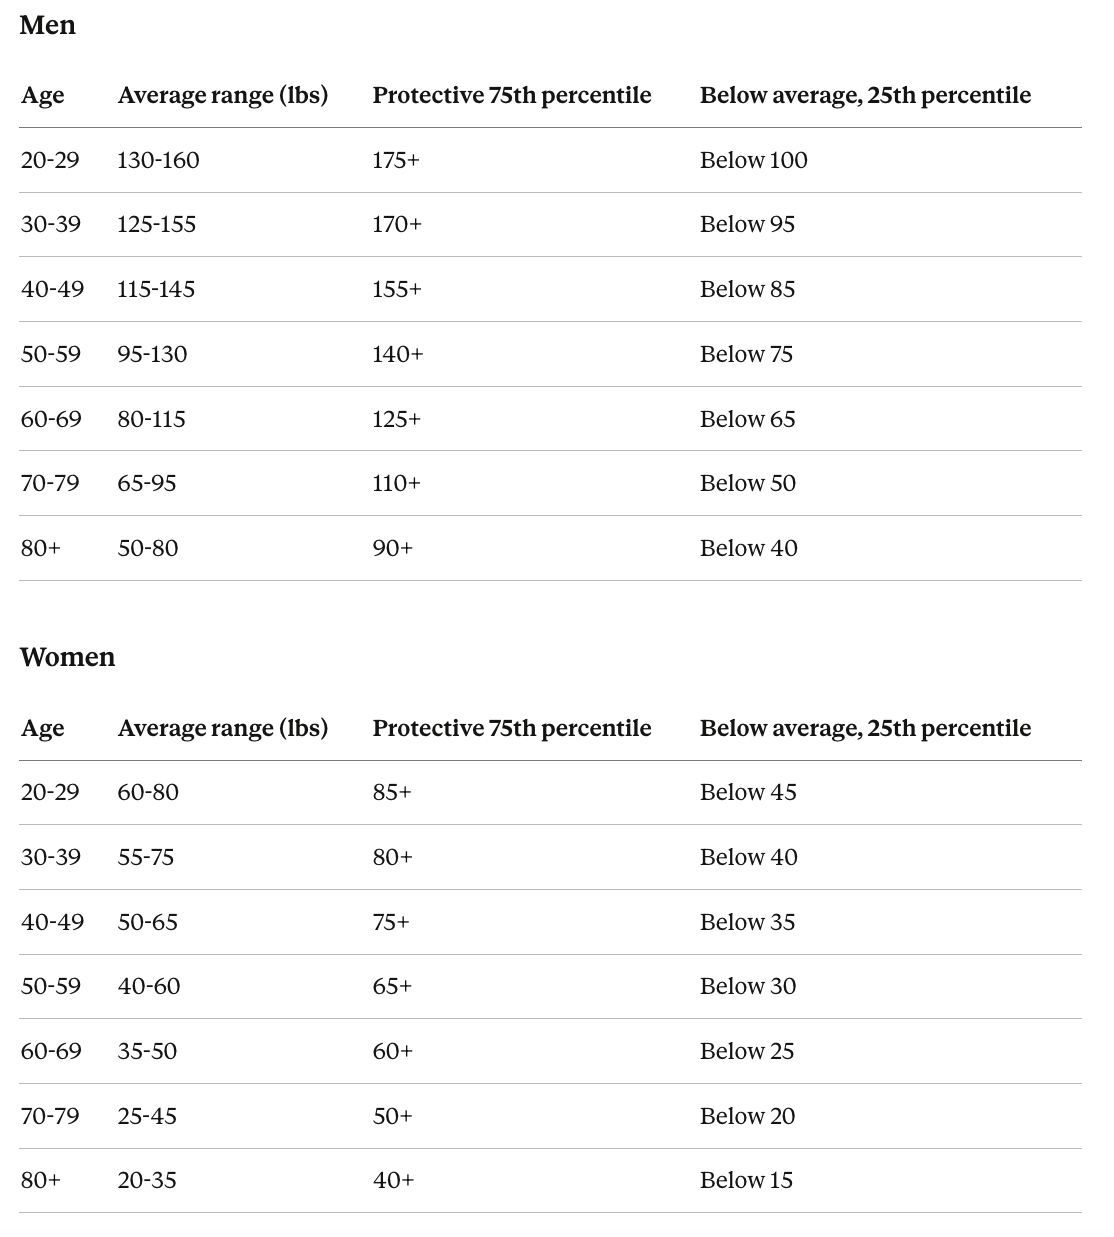
Bench press targets by age (weight for a set of 8-10 reps, in pounds)
Bench press data in aging populations are less well-studied than leg press. The Signorile study also measured chest press in older adults and found that both sexes showed declines across the half-decades from 60 to 85. The Cooper Center data and ACSM testing norms provide additional reference points for younger adults.
What about body weight exercises?
The 2019 Harvard firefighter study found that men who could complete more than 40 pushups had a 96% lower risk of cardiovascular events over 10 years compared to those who could do fewer than 10. That's a striking number from a prospective cohort, and pushups are a functional test anyone can do at home, just like the sit-to-stand and sit-rise tests.
This probably also translates to planks and pull ups, although we don’t have direct human studies.
What these gym numbers do and do not tell you
Leg press and bench press capture raw force production in a fixed path of motion. They do not capture the speed, coordination, and balance components that the mortality research identifies as more important than peak force alone. Read these tables as a baseline for raw force production, not as a complete picture of functional fitness. Farmer’s carries (walking while holding heavy weights at your sides), loaded step-ups, kettlebell swings, explosive bodyweight squats, and single-leg balance work all train qualities that are closer to what the longevity research actually measures.
The rate of decline accelerates, which is why building reserves in midlife matters
The trajectory of muscle function over a lifetime follows a consistent pattern across all the measures described above. Strength and power peak in the late 20s to early 30s, remain relatively stable through the mid-40s, and then begin a decline that accelerates with each passing decade.
The Longevity Check-Up 7+ data show three distinct life phases for muscle function. First, an increase to peak in early adulthood between ages 18 and 24. Second, maintenance through midlife from roughly 25 to 44. Third, a progressive decline from age 45 onward, with people in their 70s having lost about 30% of their peak strength. Power drops even faster, declining 10-12% per decade from age 50 onward.
This trajectory has practical consequences. A 50-year-old at the 75th percentile of strength who experiences normal age-related decline will still be comfortably above the disability threshold at 80. A 50-year-old at the 50th percentile undergoing the same decline may cross below it. The window between ages 30 and 50 is when building an above-average reserve makes the greatest difference in where you end up decades later.
Resistance training produces specific and measurable benefits for the brain
Beyond its effects on muscle and metabolic health, resistance training appears to be uniquely neuroprotective (meaning it specifically helps protect brain cells from damage and degeneration). And the evidence here goes well beyond “exercise is good for you.”
Resistance exercise outperforms aerobic exercise for cognitive improvement per dose
A 2022 analysis pooling data from multiple studies by Dr. Daniel Gallardo-Gómez and colleagues found that clinically meaningful cognitive improvements occurred at lower doses for resistance exercise than for aerobic exercise, supporting the WHO recommendation to emphasize resistance training in exercise programs for older adults.
Resistance training changes brain structure in ways that may protect against Alzheimer’s
A 2024 review examined controlled experiments using brain scans to assess the impact of resistance exercise on brain regions affected by Alzheimer’s disease. The review found that resistance exercise reversed some harmful structural brain changes and improved associated cognitive functions, with evidence suggesting a minimum of 2 sessions per week for at least 6 months. Protected brain regions included the hippocampus (a seahorse-shaped structure deep in the brain that is critical for forming new memories) and white matter tracts in the cingulate cortex (pathways that connect different brain regions and allow them to communicate), both of which are among the earliest structures affected by Alzheimer’s.
A systematic review by Dr. Fabian Herold and colleagues found growing evidence that muscular strength and muscle mass are linked to cognitive function, and concluded that engaging regularly in resistance training across the lifespan appears essential for both physical and brain health.
The mechanisms involve growth factors and reduced brain inflammation
Each session of resistance exercise triggers a temporary release of BDNF (brain-derived neurotrophic factor), a protein that supports the growth, survival, and connection-building of brain cells. Think of it as fertilizer for neurons. According to a 2025 review in Frontiers in Physiology, habitual resistance training increases the amount of BDNF released after each session over time. These repeated spikes may be an important trigger for longer-term brain-protective changes.
A 2023 controlled experiment using brain imaging showed that older adults who gained strength from a 12-week resistance training program had simultaneous improvements in brain chemistry markers of brain health. Those who started with the worst cognitive scores and brain chemistry profiles showed the greatest response, suggesting that the people who stand to benefit most are the ones with the most ground to recover.
Both moderate and heavier training work for brain benefits
A 2025 study compared two different training intensities (a heavier protocol of 8-12 reps per set versus a lighter protocol of 10-15 reps per set) in 120 older women over 12 weeks. Both protocols, involving 8 whole-body exercises for 3 sets performed 3 times per week, significantly improved cognitive test scores and reduced symptoms of depression and anxiety. Other research has found that training at moderately heavy loads for 6-8 reps per set once or twice per week for 12 months improved selective attention, the ability to focus while filtering out distractions, and memory for associations between items.
The takeaway is that you do not need to lift at your absolute maximum to achieve brain benefits. Moderate intensity, performed consistently at a frequency of at least twice per week, appears sufficient.
The brain-optimized resistance training prescription
Combining the evidence from multiple reviews and controlled experiments, the training parameters most consistently associated with brain improvements look like this.
Frequency. A minimum of 2 sessions per week. Below that threshold, evidence for structural brain changes becomes inconsistent. The minimal effective dose framework from major exercise science organizations suggests at least 30-60 minutes per session, at least twice per week.
Intensity. About 60-80% of your maximum for a given lift (roughly the weight you can handle for 8-12 controlled reps per set) appears to be the sweet spot. Going heavier does not appear to add further brain benefit while increasing injury risk. Training with very light weights (below about 40% of max) may not generate a sufficient growth factor response.
Duration. The 6-month mark is when structural brain changes, including preservation of the hippocampus and protection of white matter pathways, reliably appear on imaging studies.
Exercise selection. Compound, multi-joint movements (squats, deadlifts, rows, presses) produce larger hormonal and brain-protective responses than isolation exercises (curls, leg extensions) at the same relative effort, because they recruit more total muscle mass.
Include power and complexity. The evidence that muscle power predicts 10-year cognitive decline and brain shrinkage, even after controlling for genetics and physical activity, adds another reason to include explosive movements. Kettlebell swings, cleans, jump variations, and simply performing the lifting phase of any exercise with intent to move fast all train the speed component that declines fastest with age and has the strongest relationship to both physical and cognitive outcomes.
Putting it together
The central message from the longevity research on muscle is not about aesthetics or gym personal records. It is about building a reserve of functional capacity that keeps you above the threshold for independent living, resilient brain function, and metabolic health as decades pass.
What to train and why
Not all body parts carry equal weight in the mortality research, but functional independence at 80 requires pushing, pulling, carrying, squatting, hinging, and stabilizing in every direction. Here is how the evidence stacks up.
Lower body has the strongest research support. The sit-to-stand and muscle power studies showing 5- to 7-fold mortality differences are almost entirely driven by leg strength and leg power. Squats, leg press, lunges, step-ups, and deadlifts should form the foundation of any longevity-focused program.
Grip and forearms are the most validated predictor of survival in the strength literature. Farmer’s carries, dead hangs, and dedicated grip training deserve a place in every program.
Upper body push and pull (bench press, overhead press, rows, pull-ups) matter for daily function and have some direct evidence from the Cooper Center stroke data. They also contribute to fall recovery, since catching yourself requires arm and shoulder strength.
Core and trunk stability rarely appears in mortality studies directly, but it underpins balance, fall prevention, and spinal health after age 60.
The overarching principle is to prioritize compound movements over isolation work and perform the lifting phase of every repetition with explosive intent to train both strength and power simultaneously.
The timeline matters as what you build before age 50 determines what you have left at 80. Being average at 50 may not be enough to remain above the disability threshold at 80. Building to the 75th percentile or above during midlife creates a buffer for normal age-related decline.
The prescription: two to three sessions per week of compound resistance training at moderate to high intensity, performed with intent to move the weight quickly on every rep, supplemented by grip training and balance work. Aim to be in the 75% or greater in terms of strength and power for your age and sex. This same prescription simultaneously protects the brain, preserves metabolic health, reduces fall risk, and extends functional independence.
That said, resistance training works best as part of a broader program that also includes aerobic training, flexibility work, and balance challenges. Each type of exercise activates different protective pathways and increases the volume of different brain areas, and the benefits are additive. For a deeper look at the full exercise prescription for brain health, including how much cardio you need and how different exercise types complement each other, see my article on exercise for cognitive sharpness and dementia prevention.

Written by
Dr. Christin Glorioso, MD PhD
Dr. Glorioso is the founder and CEO of NeuroAge Therapeutics. With her background in neuroscience and medicine, she is dedicated to revolutionizing brain health and helping people maintain cognitive vitality.
Learn more about Dr. Glorioso

