
Carbs and the Brain. What the Science Actually Says.
Do you need carbs? Are they hurting you? And should you be wearing a CGM?

If you follow longevity or brain health content, you have probably encountered the idea that carbohydrates are bad for you. Sugar is toxic. Glucose spikes are destroying your brain. Go keto or go home.
I practice intermittent fasting, which has at times put me into ketosis, and have written about the potential benefits and risks of keto for brain health. But the relationship between carbohydrates and the brain is far more nuanced than social media would have you believe.
Your brain is the most glucose-hungry organ in your body. And the type of carbohydrate you eat, the stability of your blood sugar, and your underlying metabolic health matter far more than whether you eat carbs at all.
Your Brain’s Default Fuel Is Glucose
Your brain makes up about 2% of your body weight but consumes roughly 20 to 25% of your body’s total glucose. In children it’s even more dramatic. At peak brain development, the brain uses glucose equivalent to 66% of the body’s resting metabolism.
Glucose powers neurotransmission, synaptic signaling, and the ion pumps that maintain the electrical gradients neurons depend on. But it also serves critical non-energy functions, including feeding the pentose phosphate pathway that manages oxidative stress, serving as a substrate for neurotransmitter synthesis, and being stored as glycogen in astrocytes for emergency reserves. A 2023 Gladstone Institutes study settled a long-standing debate by showing that neurons metabolize glucose directly through glycolysis. When researchers used CRISPR to knock out neuronal glucose import, the result was neurodegeneration. The brain even maintains its own independent glucose “microsystem” that has evolved to ensure uninterrupted fuel supply.
There is, however, an important alternative fuel source. Understanding glucose’s central role is essential before we talk about what happens without it.
But Wait. Don’t You Need to Eat Carbs?
Your brain requires glucose. But your body does not require you to eat it. When carbohydrate intake is very low, the liver manufactures glucose from amino acids, lactate, and glycerol (gluconeogenesis) and converts fatty acids into ketone bodies, primarily beta-hydroxybutyrate (BHB) and acetoacetate, that cross the blood-brain barrier as alternative fuel. On a well-formulated ketogenic diet, ketones can supply up to 75% of the brain’s energy needs, with gluconeogenesis covering the rest. The National Academy of Medicine acknowledged in 2005 that the lower limit of dietary carbohydrates compatible with life is apparently zero.
So the brain can function without dietary carbohydrates. The more important question is whether it functions optimally without them.
BHB is actually a more efficient fuel than glucose on a per-molecule basis, and a 2018 randomized controlled study found that BHB infusion reduced cerebral glucose uptake by 14% while cerebral blood flow increased by 30%. But for a healthy brain with plenty of glucose available, the evidence suggests the brain does not perform better on ketones, and may actually perform worse during the adaptation period and potentially longer term.
Where ketones become genuinely interesting is in Alzheimer’s disease, where the brain progressively loses its ability to take up and use glucose. Ketones may provide a critical backup fuel source for brains that are losing access to their primary one. I cover the mechanism and clinical trial evidence for this in the sections below.
On the other hand, the adaptation period to ketosis (the “keto flu”) involves real cognitive symptoms. And for certain populations, including APOE4 carriers like myself, the long-term metabolic effects of very high fat intake on cardiovascular risk factors deserve serious consideration. I wrote about some of these tradeoffs in a previous article.
Complex vs. Simple Carbs. This Is Where It Gets Real.
If you do eat carbohydrates, and most people do, the type matters a great deal for your brain.
A comprehensive 2025 review in Food Science & Nutrition examined the relationship between dietary carbohydrates and cognitive function and found a clear pattern. Simple carbohydrate intake (think added sugars, refined grains, sugary beverages) is consistently linked to worse cognitive outcomes across studies. Complex carbohydrate intake (whole grains, legumes, fruits, vegetables) is associated with both short-term and long-term memory improvement and successful brain aging.
Why? Several mechanisms are at play.
Glucose stability matters more than glucose availability. Your brain is exquisitely sensitive to the rate of change in blood glucose, not just its absolute level. Complex carbohydrates release glucose slowly and steadily, keeping the brain in its optimal operating range. Simple carbohydrates cause rapid spikes followed by crashes. These swings trigger insulin surges, reactive hypoglycemia, oxidative stress, and neuroinflammation, all of which are bad for neurons.
The glycemic index predicts brain health outcomes. A major UK Biobank study published in the International Journal of Epidemiology in October 2025 (Novau-Ferré et al.) followed 202,302 dementia-free adults for an average of 13.25 years. They measured dietary glycemic index (GI) and glycemic load (GL) using 24-hour dietary recall questionnaires and found that diets with lower GI values were associated with reduced risk of developing dementia, including Alzheimer’s disease. The researchers identified a GI inflection point at 49.30 and a GL inflection point at 111.01, above which risk increased. High GI diets were associated with a 14% increase in Alzheimer’s risk, while low-to-moderate GI diets were linked to a 16% decrease. An important clarification about this study. It measured carbohydrate quality (glycemic index) and total glycemic burden (glycemic load), not carbohydrate percentage. The press materials note that carbohydrates account for approximately 55% of total energy intake in the typical UK diet, but that is a contextual observation, not a study finding. This study cannot tell us whether 40% versus 55% of calories from carbs would produce different outcomes if the GI were held constant. For that question, we need the macronutrient percentage studies I discuss later in this article. What Bulló and colleagues confirmed is that carbohydrate quality, specifically choosing low-GI foods like fruit, legumes, and whole grains over high-GI refined carbs, is a significant modifiable factor in dementia risk.
Complex carbs feed your gut-brain axis. Complex carbohydrates increase the diversity of gut bacteria and promote the synthesis of short-chain fatty acids, which regulate energy metabolism and inflammation in the brain. This is an often-overlooked pathway by which the carbs you eat affect cognitive function.
A note on glycemic index (GI). The GI ranks carbohydrate-containing foods on a scale of 0 to 100 based on how quickly they raise blood sugar compared to pure glucose. Low-GI foods (55 or below) include most fruits, legumes, and intact whole grains. Medium-GI foods (56 to 69) include some whole grain breads and brown rice. High-GI foods (70 and above) include white bread, most white rice, and potatoes. The GI of a food changes depending on how it is processed and what you eat it with. Steel-cut oats have a GI of about 55; instant oatmeal comes in at 79. Adding protein, fat, or fiber to a carb-heavy meal lowers the overall glycemic response.
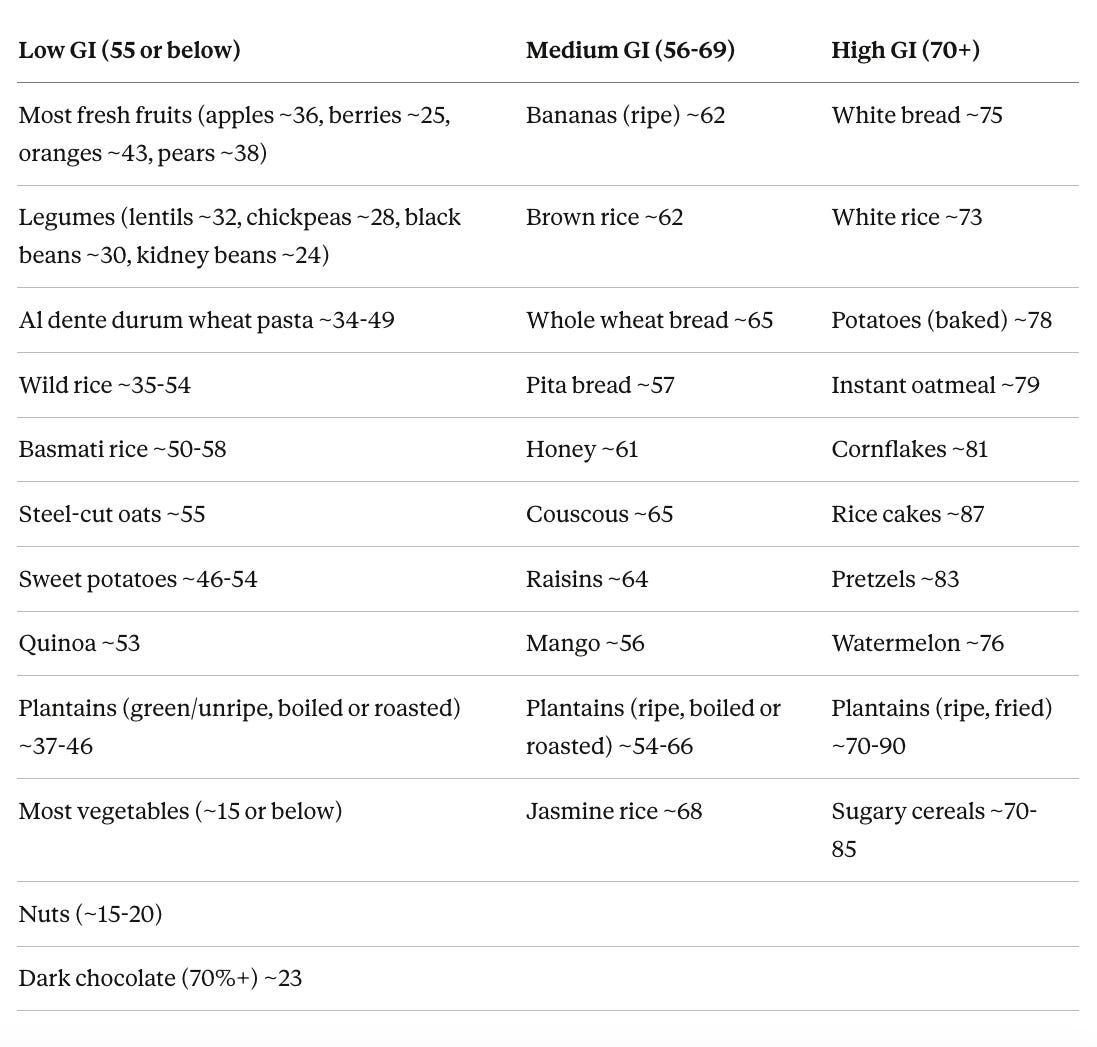
GI values are approximate and vary by preparation, ripeness, brand, and what you eat them with. Cooking pasta past al dente, for example, can push it from low into medium GI. Plantains are a dramatic example of how ripeness and cooking method change everything. A boiled green plantain (GI ~37) and a fried ripe plantain (GI ~90) are essentially different foods metabolically. Basmati rice sits on the low-to-medium border depending on the variety and cooking method, but its high amylose starch content makes it digest significantly slower than regular white rice. Pairing any carb with protein, fat, or fiber lowers the overall glycemic response of the meal.
A word about pasta, because I am of Italian heritage and also because what I’m about to say might surprise you. If you’ve spent any time in longevity or low-carb communities, you’ve probably absorbed the idea that pasta is a “refined carb” in the same category as white bread and sugary cereals. I used to think this too. The data tells a different story. A systematic review in Nutrition, Metabolism and Cardiovascular Diseases found that pasta is actually a low-GI food (GI ≤ 55) and an important but overlooked low-GI component of the Mediterranean diet. This is surprising because pasta is mostly starch, yet it behaves nothing like other starchy foods such as potatoes (GI 75-87) or white bread (GI 75).
The reason is structural. Durum wheat semolina, the base of traditional pasta, has coarse endosperm with largely intact cell walls, unlike finely milled wheat flour where the cellular structure has been destroyed. A 2024 paper in the Journal of Nutrition made this point directly, arguing that pasta gets classified as a “refined carbohydrate” and placed in “unhealthy plant-based diets” despite health benefits and a lack of negative effects in both epidemiological and clinical trial data. The authors argue our terminology around refined carbs is simply too blunt to capture the structural complexity of a food like pasta.
How low can pasta go? A study testing conventional Italian spaghetti found GI values as low as 34.1 and 37.8 for standard durum wheat varieties. That is lower than most fruits and well below the UK Biobank study’s dementia-risk inflection point of 49.30. Cooking method matters a lot here. Al dente pasta retains more of its compact starch structure, keeping the GI low. Overcooking breaks that structure down and raises the glycemic response significantly (if you need another reason to not make this culinary faux pas). So a plate of al dente spaghetti marinara with good olive oil, cooked from traditional durum wheat, is not the metabolic disaster that low-carb culture would have you believe. It’s a legitimately low-GI meal, especially when paired with vegetables, protein, or healthy fats.
There’s a reason Italy has some of the highest life expectancy in Europe. The lesson here is the same one that keeps emerging throughout this article. Carbohydrate quality and food structure matter far more than simplistic labels like “refined” or “complex.” Pasta, eaten in the traditional Mediterranean way, is closer to legumes on the glycemic spectrum than it is to white bread.
All of the evidence above is observational, though. Observational studies can identify associations, but only randomized controlled trials (RCTs) can establish causation. So let’s look at what the trials actually show.
What the Clinical Trials Actually Show
The reality is that RCT evidence for a specific carbohydrate percentage that prevents or treats dementia is still limited. But what we do have is increasingly interesting.
The MIND Diet Trial (NEJM, 2023). The MIND trial was a 3-year Phase III trial of 604 cognitively unimpaired older adults with a family history of dementia, randomized to either the MIND diet (a Mediterranean/DASH hybrid emphasizing low-GI carbs over refined ones) with caloric restriction, or a control diet with the same caloric restriction. Both groups improved in cognition with no significant difference between them. Disappointing on the surface, but the control group also substantially improved their diet quality during the trial, making a between-group difference very hard to detect.
The FINGER Trial (Lancet, 2015). The FINGER trial was a 2-year multidomain RCT of 1,260 at-risk older adults randomized to a comprehensive intervention (diet, exercise, cognitive training, vascular risk monitoring) versus controls. The dietary component emphasized fruits, vegetables, whole grains, and fish with limited sugar and refined carbs. The intervention group showed significantly better cognitive performance across multiple domains. FINGER remains the strongest trial evidence that lifestyle interventions can prevent cognitive decline, and the worldwide FINGER network (US-POINTER, EURO-FINGERS) is now testing variations in diverse populations.
The Ornish Lifestyle Medicine Trial (Alzheimer’s Research & Therapy, 2024). This Phase 2 RCT tested a comprehensive lifestyle intervention in patients with MCI or early AD. The dietary component was whole-foods, plant-based, low in harmful fats and low in refined carbohydrates. After 20 weeks, the intervention group showed significant cognitive improvement, and greater adherence correlated with improvements in the plasma Aβ42/40 ratio (an Alzheimer’s biomarker). This is one of the few RCTs to show improvement in both cognition and AD biomarkers with a lifestyle intervention.
Ketogenic Diet Trials for Alzheimer’s. One of the earliest detectable changes in Alzheimer’s, visible on PET scans decades before symptoms appear, is brain glucose hypometabolism. The neurons progressively lose their ability to take up and use glucose. The problem is not that there isn’t enough glucose in the blood. The brain’s glucose uptake machinery is breaking down, with neurons essentially starving in a sea of glucose. Ketones bypass this because they use different transporters (MCTs instead of GLUTs), so the brain can still get fuel even when its glucose uptake is failing. A 2024 meta-analysis of 10 RCTs (691 AD patients) found that ketogenic interventions improved cognitive function, though they also raised blood lipid levels. A systematic review in Frontiers in Neurology found that cognitive enhancement depended on the level and duration of ketosis achieved, and that APOE4 carriers showed a delayed response compared to non-carriers. A Johns Hopkins RCT testing a modified Atkins diet for MCI found that achieving ketosis was feasible but adherence was difficult, especially for those with more advanced impairment. There is also an active trial at Wake Forest (BEAT-AD) comparing a modified Mediterranean ketogenic diet against a standard diet in older adults with MCI, with results expected in coming years.
The 2025 Dietary Guidelines Advisory Committee systematic review of 83 studies concluded with “moderate” evidence that dietary patterns high in vegetables, fruits, legumes, nuts, fish, and unsaturated fats, with lower intakes of red and processed meats and sugar-sweetened beverages, are associated with lower risk of cognitive decline and dementia. This doesn’t specify a carbohydrate percentage, but it clearly favors complex carbohydrate sources.
Where does this leave us? There is no RCT that has definitively established an optimal carbohydrate percentage for dementia prevention. What the trials do consistently show is that carbohydrate quality matters more than quantity. The most successful dietary interventions for cognitive health (FINGER, Ornish, Mediterranean/MIND patterns) all share common themes. They emphasize whole, unprocessed, low-GI carbohydrate sources. They limit refined sugars and processed grains. And they work best as part of a comprehensive approach that includes exercise, cognitive engagement, and vascular risk management.
But What About Carbohydrate Percentage? Does the Amount Matter?
If quality matters most, can you eat 50% of your calories from carbs as long as they’re complex? Or is there a percentage threshold where even good carbs become a problem?
Several large prospective cohort studies have addressed this directly. The Mayo Clinic cohort (937 elderly adults, 3.7-year follow-up) found that those eating more than 58% of calories from carbs had an 89% higher risk of MCI or dementia (HR 1.89), while higher fat intake was protective (HR 0.56), but the high-carb group was eating mostly sugar and fruit, not vegetables. The UK Biobank macronutrient study (93,389 adults, 8.7 years) found a U-shaped relationship. High carbs increased dementia risk 48% (HR 1.48), low carbs trended toward increased risk (HR 1.19), and moderate intake was the sweet spot. People who balanced all three macronutrients in moderate ranges had 24-29% lower dementia risk.
The most compelling structural evidence comes from the PURE-MIND study (EClinicalMedicine, 2025), which analyzed MRI brain imaging alongside dietary data in 9,886 middle-aged adults across four countries. Higher carbohydrate intake was associated with more vascular brain injury on MRI and lower cognitive scores, while higher monounsaturated fat intake was associated with less injury and better performance, in people who were still cognitively normal. Meanwhile, a UK Biobank analysis of 107,785 participants found that the carbohydrate-to-fiber ratio was more predictive of dementia risk and hippocampal volume than total carbohydrate intake alone. And a Chinese prospective cohort following elderly adults eating ~58% carbs found that cognitive decline was driven entirely by low-quality carbs. People eating the same percentage from whole grains, legumes, and vegetables did fine.
The practical takeaway is that the optimal range appears to be roughly 40-55% of calories from carbohydrates, with the risk increasing meaningfully above ~58%. But the danger zone isn’t a specific percentage. It’s a pattern of refined carbs, added sugars, and insufficient fiber that drives glucose spikes, insulin resistance, and brain inflammation. If your carbs come from berries, legumes, non-starchy vegetables, and intact whole grains, a 50% carbohydrate diet is consistent with the best available evidence.
But what about mortality? The dementia data is one thing. The all-cause mortality data tells a complementary story.
The 2018 ARIC/Lancet study (Seidelmann et al.) followed 15,428 adults for 25 years and pooled results with seven other cohorts (432,179 participants total). They found a U-shaped curve, with both low-carb (below 40%) and high-carb (above 70%) intake associated with increased mortality. The sweet spot was 50-55% of calories from carbohydrates. A 2013 meta-analysis by Noto et al. (272,216 participants) found low-carb diets associated with 31% higher all-cause mortality, but interestingly not with cardiovascular mortality specifically.
So what were they dying of? Fung et al. 2010 analyzed 129,716 participants from the Nurses’ Health Study and Health Professionals Follow-up Study and found that animal-based low-carb diets were associated with higher all-cause mortality (HR 1.23), cardiovascular mortality (HR 1.14), and notably higher cancer mortality (HR 1.28). A 2019 NHANES analysis confirmed this pattern, finding that the lowest carbohydrate intake was associated with a 32% increase in overall mortality and a 36% increase in cancer mortality.
But here is the critical nuance. In the ARIC/Lancet study, mortality increased when carbohydrates were replaced with animal-derived fat or protein (HR 1.18) and decreased when replaced with plant-based sources (HR 0.82). Fung et al. showed the same pattern. A vegetable-based low-carbohydrate diet was associated with lower all-cause mortality (HR 0.80) and lower cardiovascular mortality (HR 0.77). The problem was never low carbs per se. It was replacing carbs with processed meat and saturated animal fat instead of nuts, olive oil, avocados, and plant proteins.
These studies have real limitations, including reliance on food frequency questionnaires collected infrequently over decades, and critics have noted that no participants were actually following structured low-carb diets. But the consistency across cohorts is hard to dismiss.
On the cancer signal specifically, there is a mechanistic case for concern. Animal protein activates mTORC1 and raises IGF-1, and a 2014 Cell Metabolism study found that high protein intake in adults aged 50-65 was associated with a fourfold increase in cancer death risk, mediated partly through IGF-1, with the association abolished when proteins were plant-derived. This relationship reversed after age 65, where higher protein became protective against sarcopenia and frailty. However, a 2024 umbrella review by the German Nutrition Society found that cancer risk correlates most strongly with processed and red meat specifically, not total protein, and that carcinogenic compounds from processing and high-heat cooking are likely more responsible than the protein itself. The practical takeaway is that the mortality signal is probably not about protein per se, but about the type of animal protein, how it was cooked, and whether the overall diet includes protective plant foods that get crowded out when someone goes heavy on processed meat.
So Are Carbs Bad If You’re Metabolically Healthy?
Back to the question I get asked the most. The answer is reassuring for most people.
If you are metabolically healthy, meaning you have normal insulin sensitivity, a healthy fasting glucose, normal HbA1c, and no signs of metabolic syndrome, your body is well equipped to handle carbohydrates. Your pancreas releases insulin in appropriate amounts, your cells respond to that insulin efficiently, and your blood sugar returns to baseline within a reasonable timeframe after eating.
In this context, the brain is quite resilient to normal postprandial glucose fluctuations. A fascinating 2024 study in npj Digital Medicine that paired continuous glucose monitoring with real-time cognitive testing in 200 adults found that optimal cognitive performance actually occurred at glucose concentrations slightly above each individual’s personal mean, regardless of whether that mean was in the euglycemic or mildly elevated range. In other words, the brain seems to habituate to whatever glucose environment it lives in, and performs best when glucose is stable and slightly above its usual level.
The problems arise when metabolic health breaks down. Insulin resistance changes the entire equation. A 2024 study in Nutrition & Diabetes found that insulin-resistant individuals had significantly higher glucose variability on CGM and that greater glucose fluctuations were associated with worse working memory performance. The insulin-resistant group also had higher inflammatory markers like CRP, which independently harm cognition.
A 2025 study in the Journal of Clinical Endocrinology & Metabolism found that in patients with type 2 diabetes, visit-to-visit glucose variability was associated with measurable changes in brain structure and worse cognitive performance. Higher glucose variability correlated with cortical thinning and reduced gray matter volume.
A 2025 paper in Alzheimer’s & Dementia proposed that cognitive vulnerability to glucose fluctuations may actually serve as a “digital phenotype” of neurodegeneration, meaning that how your brain responds to glucose variability could be an early biomarker for dementia risk.
So the bottom line is this. If you are metabolically healthy, moderate carbohydrate intake from complex, whole-food sources is unlikely to harm your brain and may actually support it. If you have insulin resistance, prediabetes, or type 2 diabetes, glucose variability becomes a much more significant concern, and tighter management of carbohydrate quality and quantity is warranted.
Continuous Glucose Monitors. A Tool for Everyone?
This brings us to continuous glucose monitors (CGMs), which have gone from a medical device for diabetics to a wellness tool marketed to anyone who wants to understand their metabolic health. I’m a fan of the concept, with some caveats.
What a CGM Does
A CGM is a small sensor (usually worn on the back of the arm or abdomen) that measures glucose in the interstitial fluid every 1 to 15 minutes and transmits that data to your smartphone. Unlike a fingerstick, which gives you a single snapshot, a CGM shows you the continuous trajectory of your glucose throughout the day and night. You can see how meals, exercise, stress, sleep, and even individual foods affect your glucose levels in real time.
The Current Landscape of CGMs
The CGM market has expanded dramatically, and there are now options for virtually every type of user.
Prescription (clinical-grade) CGMs are designed for people with diabetes, particularly those on insulin. These include the Dexcom G7 (15-day wear, high accuracy, real-time alerts, integrates with insulin pumps), the FreeStyle Libre 3 Plus from Abbott (15-day wear, compact, affordable, real-time Bluetooth transmission), the Medtronic Guardian 4 (integrates with MiniMed 780G insulin pump for automated insulin delivery), and the Eversense 365 (an implantable sensor that lasts up to one year, placed by a healthcare provider, with a removable external transmitter).
Over-the-counter (wellness) CGMs are designed for non-diabetic users or those with type 2 diabetes not on insulin. These include Dexcom Stelo (based on G7 technology, no prescription needed, 15-day wear, integrates with Oura Ring, focuses on glucose trends without medical alerts) and Abbott Lingo (simplified glucose tracking with a proprietary “Lingo count,” OTC, budget-friendly at about $49 per two-week sensor).
CGM-plus-coaching programs pair CGM data with personalized guidance. Nutrisense pairs compatible biosensors like Stelo with an app and optional access to registered dietitians for insurance-covered 1-on-1 video consultations. Levels Health overlays glucose data with food and activity logs for metabolic insights.
How Accurate Are They, and What Do They Cost?
Accuracy is measured by MARD (Mean Absolute Relative Difference), the average percentage error versus a lab reference. Lower is better. Manufacturer-reported numbers look good across the board (7.9-10.8%), but independent head-to-head testing tells a different story. A 2024 study that had 55 adults wear the FreeStyle Libre 3 and Dexcom G7 simultaneously found the Libre 3 significantly more accurate (MARD 8.9% vs 13.6%), with the gap widening after the first 12 hours. A 2025 three-way comparison (Libre 3, G7, and Medtronic Simplera) confirmed that the G7 and Libre 3 tracked post-meal spikes more accurately, while the Simplera had a rough first 12 hours (MARD ~20%). For the OTC devices, the Stelo uses the same G7 sensor hardware, and the Lingo has no published clinical MARD data.
On cost, the FreeStyle Libre 3 is the most affordable prescription CGM at ~$160/month, while the Dexcom G7 runs ~$450/month. For my readers who don’t have diabetes and just want to understand their metabolic patterns, the OTC options are more practical. The Dexcom Stelo at ~$99/month and the Abbott Lingo at ~$98/month, both FSA/HSA eligible, no prescription needed. The MARD differences between devices matter for insulin dosing, but for tracking post-meal trends and overall patterns, any of these will give you useful data.
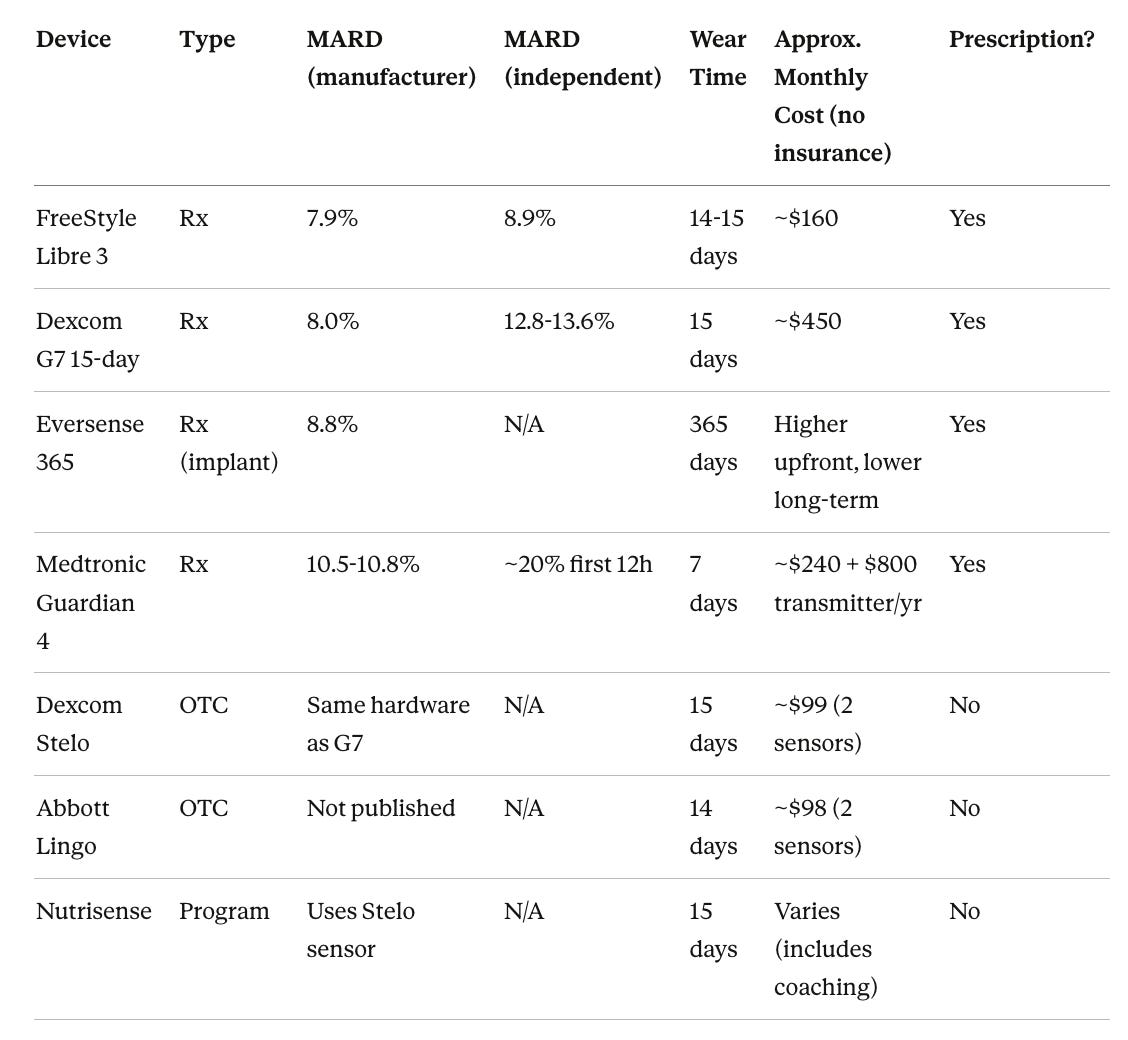
MARD = Mean Absolute Relative Difference. Lower is more accurate. Independent MARD figures come from the 2024 head-to-head study (Abbott-funded) and the 2025 Eichenlaub et al. three-way comparison. Costs are approximate, without insurance, as of early 2026.
What We Know About CGMs in Non-Diabetic People
A 2021 study tracked nearly 500 people without diabetes using CGMs and found that 15% of apparently healthy individuals had glucose excursions into the diabetic range. This suggests that traditional testing (fasting glucose, HbA1c) may miss meaningful glycemic variability that only a CGM can catch.
A 2025 study in Diabetes Care compared three current-generation CGM systems worn simultaneously and found that they can display discordant glucose profiles, meaning the accuracy and metrics can vary between brands. This is worth knowing if you are tracking precise numbers.
My Take on CGMs for Brain Health
I think a short trial with a CGM (even just 2 to 4 weeks) can be extremely valuable for anyone who is serious about brain health. Here’s what you can learn.
Which foods spike you. Two people can eat the same bowl of rice and have wildly different glucose responses based on their genetics, gut microbiome, metabolic health, and even what they ate the day before. A CGM shows you your personal response, which is far more useful than a GI chart.
How your habits affect your glucose. Sleep, stress, exercise timing, meal order (eating protein and vegetables before carbs), and intermittent fasting all show up on a CGM in ways you cannot detect by feel alone.
Whether you have hidden dysglycemia. If your fasting glucose and HbA1c look normal but your CGM reveals a different story, that is worth knowing. I cover what “normal” and “concerning” actually look like on a CGM in the next section.
That said, I agree with some clinicians who caution that OTC CGMs can create anxiety in metabolically healthy people who start worrying about normal postprandial fluctuations. If you are not diabetic, your glucose will go up after meals. That is normal. The question is how high, how fast, and how quickly it comes back down. It’s about the pattern, not perfection.
So What Should You Actually See on a CGM?
This is the question everyone asks, and the answer has gotten clearer in the last few years as more studies have put CGMs on healthy people. Here’s a quick reference based on the best available data.
What healthy non-diabetic bodies actually do. A multicenter prospective study by Shah et al. (2019) put CGMs on 153 healthy participants ages 7 to 80 and found that mean average glucose was 98-99 mg/dL for most age groups (104 mg/dL for those over 60). These healthy individuals spent a median of 96% of their time between 70-140 mg/dL, with only about 30 minutes per day above 140 and about 15 minutes per day below 70. Their glucose variability, measured by coefficient of variation, averaged 17%. A study of 434 healthy adults found that one-hour post-meal glucose values averaged 121-123 mg/dL for all three meals, with peaks appearing around 60 minutes after eating. The ZOE PREDICT studies, the largest dataset of its kind with 4,805 healthy non-diabetic individuals, found mean fasting glucose of 91 mg/dL and time in the 70-140 range of about 91%. But here’s the finding that matters most for brain health optimization. The PREDICT researchers found that the standard 70-140 mg/dL range was too loose to discriminate cardiovascular risk in healthy people. When they applied a tighter range of 70-100 mg/dL, meaningful differences in cardiovascular risk and HbA1c emerged between the top and bottom quintiles. This suggests that for people who are already metabolically healthy and want to optimize, the tighter range is where the signal is.
Normal range (what a healthy body does without any intervention). Fasting glucose of roughly 85-99 mg/dL. Post-meal peaks of 120-140 mg/dL, occurring about 60 minutes after eating, with a rise of less than 40 mg/dL above your pre-meal baseline. Time in the 70-140 range of 93-96% of the day, meaning you spend 30 minutes or less above 140. Glucose variability (coefficient of variation) of about 17% or less. Return to pre-meal baseline within 2-3 hours.
Optimization targets (what wellness-focused practitioners recommend). Post-meal peaks under 110 mg/dL. Rise from pre-meal levels of no more than 30 mg/dL. Average glucose between 79-100 mg/dL. More time in the tighter 70-100 mg/dL range. Coefficient of variation below 20%. These are aspirational targets, not medical thresholds, and whether they translate to meaningfully better long-term brain outcomes compared to the “normal” range is still an open question.
Patterns worth discussing with your doctor. Frequent spikes above 140 mg/dL, especially if they last more than 30-60 minutes before coming down. Reactive drops below 70 mg/dL after meals, which suggests your insulin response is overshooting. Remember from earlier in this section that 15% of apparently healthy people show glucose excursions into the diabetic range on CGM, so “looking fine on a fasting blood draw” does not always mean your glucose regulation is actually fine.
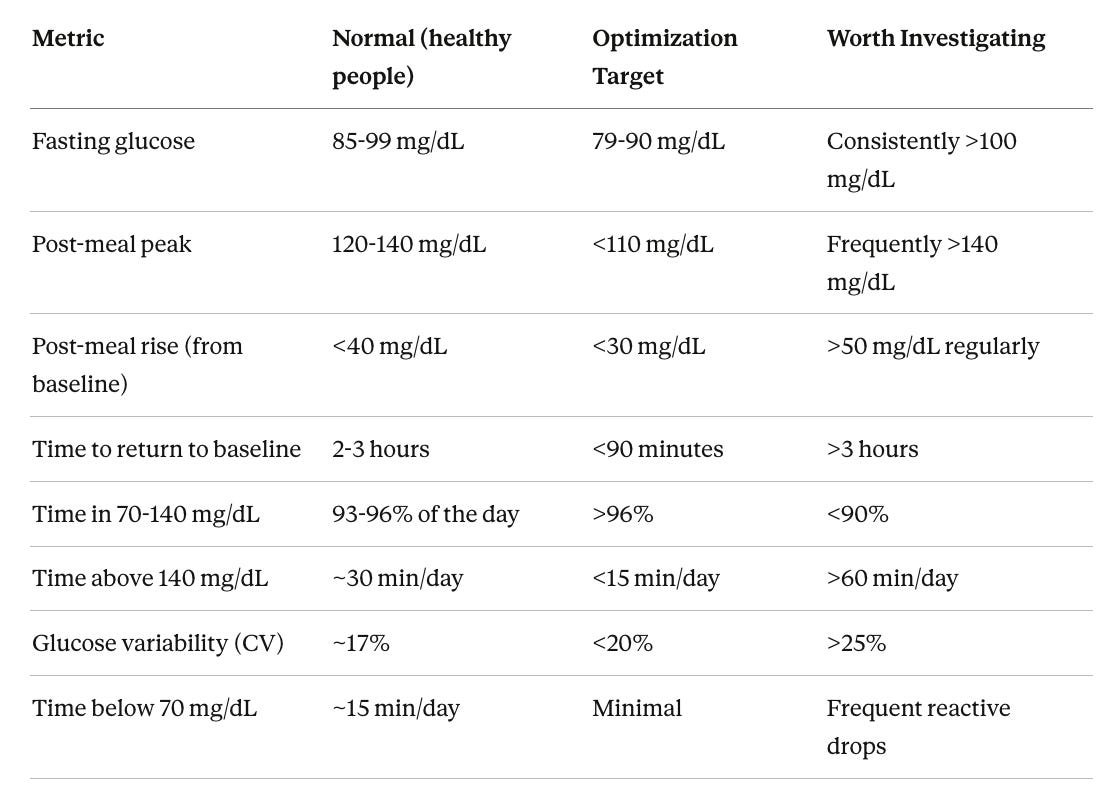
“Normal” values are based on Shah et al. (2019, n=153), the ZOE PREDICT studies (n=4,805), and a 434-person CGM cohort. “Optimization targets” reflect wellness practitioner recommendations and the PREDICT finding that a tighter 70-100 mg/dL range better discriminates cardiovascular risk. “Worth investigating” patterns warrant a conversation with your doctor, not a diagnosis.
One last point. Briefly touching 145 or 150 mg/dL after a big meal and coming back to baseline within 90 minutes is normal human physiology. Hitting 160+ after every meal and taking 3 hours to return to baseline is a different story. Context and pattern matter far more than any single reading.
What I Actually Do
I’ll end with what I practice myself, which as always is a work in progress.
I practice intermittent fasting (I don’t usually eat before noon and sometimes not until late afternoon) and focus on whole, unprocessed foods with an emphasis on the Mediterranean pattern. I don’t actually think IF is better than caloric restriction, it’s just easier for me to portion control. My approach to carbs is to most of the time choose low-GI sources (berries, legumes, non-starchy vegetables), pair them with protein and fat, and avoid refined sugars and processed grains. Given my APOE4 status and the cardiovascular concerns I’ve been tracking, I’m thoughtful about both the quality of my carbohydrates and my overall metabolic health.
A Day of Eating for Brain Health
People always ask me what I actually eat in a day, so here’s a typical example. This lands somewhere around 40-45% complex carbs, 30-35% healthy fats, and 20-25% protein, which is consistent with the moderate macronutrient balance that the research supports. I skip breakfast most days because of my intermittent fasting window, so this is really two meals and a snack.
First meal (around noon or later). A large salad with mixed greens, arugula, half an avocado, wild-caught salmon, a handful of walnuts, cherry tomatoes, cucumber, and a generous pour of extra-virgin olive oil with lemon. Sometimes I’ll add a quarter cup of cooked lentils or chickpeas for extra fiber and plant protein. This is my nutrient-dense, anti-inflammatory base for the day. The greens provide folate and polyphenols. The fatty fish provides omega-3s. The olive oil and avocado provide monounsaturated fats, which the PURE-MIND study specifically linked to less vascular brain injury.
Afternoon snack. A berry and yogurt smoothie blended with almond milk (the MIND diet identifies berries as its top fruit recommendation for brain health). Sometimes a piece of dark chocolate (85% or higher) and a small portion of macadamia nuts or almonds. This gives me antioxidants, protein, and healthy fats without spiking glucose. Berries in particular have strong observational data for cognitive protection.
Dinner. This is where I include more complex carbs. Some of my go-to dinners include chicken cacciatore packed with mushrooms, peppers, onions, and tomatoes in olive oil, Mediterranean diet in a single pan. Pan-sautéed wild salmon with spinach is a weekly staple for the omega-3s and folate. I eat sushi frequently (fish and seaweed have high Omega-3 content). I also love eggplant parmesan, chicken curry, and chana masala (cooked in olive oil instead of butter or ghee to keep the fat profile Mediterranean-friendly). Georgio’s Greek stew is another favorite, often served alongside Grace’s kale salad. One of my favorite easy dinners is al dente spaghetti with marinara loaded with greens (spinach, kale, or artichokes stirred right into the sauce) and grilled chicken. Traditional durum wheat pasta cooked al dente has a surprisingly low glycemic index, well below the threshold linked to increased dementia risk, and it’s a staple of the Mediterranean diet for good reason.
What I avoid. White bread, chips, sugary drinks, breakfast cereals, packaged snacks, and anything with added sugar. I don’t eat these because the evidence linking refined carbohydrates and added sugars to both metabolic dysfunction and cognitive decline is just too consistent to ignore.
What I drink. Water, coffee with half and half (during my fast), green tea in the afternoon. I avoid fruit juice entirely as it’s basically sugar without the fiber that makes whole fruit beneficial.
The goal isn’t perfection. It’s a consistent pattern where the vast majority of my carbohydrates come from vegetables, legumes, berries, and occasionally intact whole grains, eaten alongside healthy fats and quality protein. That combination keeps glucose stable, feeds the gut microbiome, provides the brain with steady energy, and keeps inflammation low.
The Bottom Line
Your brain is the most glucose-dependent organ in your body, and while it can run on ketones, healthy brains do not appear to perform better on them. The clinical trials consistently point not to a specific carbohydrate percentage but to carbohydrate quality. Low-glycemic, fiber-rich, whole-food sources like vegetables, legumes, berries, and intact grains protect the brain, while refined carbs, added sugars, and high-GI foods increase dementia risk.
The optimal range for total carbohydrate intake appears to be roughly 40-55% of calories, with both very low-carb and very high-carb diets associated with increased mortality, though the mortality signal is driven largely by what replaces the carbs (animal fat and processed meat increase risk; plant-based sources decrease it). For people who are metabolically healthy, moderate carbohydrate intake from complex sources is well tolerated and likely protective. For those with insulin resistance or prediabetes, glucose variability becomes a more serious concern, and a CGM can help identify individual trouble spots that population-level data cannot.
Where ketogenic diets show the most promise is not in healthy brains but in Alzheimer’s disease, where glucose uptake is failing and ketones offer a bypass. And throughout all of this, carbohydrate structure matters in ways our labels miss entirely. Al dente pasta behaves more like lentils than like white bread, and a boiled green plantain and a fried ripe one are metabolically different foods.
Choose your carbs wisely, know your metabolic status, and pay attention to the data. Your brain will thank you.

Written by
Dr. Christin Glorioso, MD PhD
Dr. Glorioso is the founder and CEO of NeuroAge Therapeutics. With her background in neuroscience and medicine, she is dedicated to revolutionizing brain health and helping people maintain cognitive vitality.
Learn more about Dr. Glorioso

